“Photosynthetic productivity in the oceans’ euphotic zone leads to accumulation of biomass, the fate of which on different spatial and temporal scales determines the biological pump’s role in the global carbon cycle”(Kostadinov et al 2009, 2).
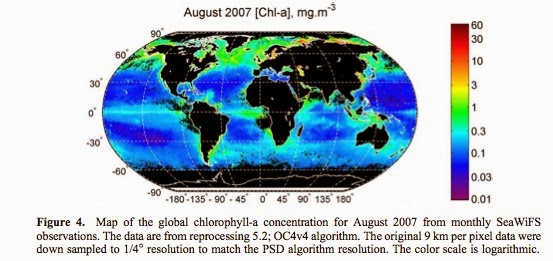
In their paper entitled “Retrieval of the particle size distribution from satellite ocean color observations” published in the Journal of Geophysical Research, Kostadinov, Siegel, and Maritorena of University of California at Santa Barbara explore using Geographic Information Systems (GIS) to project the PSD of the world’s oceans. In order to calculate what the world looks like in terms of Chlorophyll-a (Chl) concentration and PSD the authors utilized three distinct theories/ algorithms:
3) Mie Theory
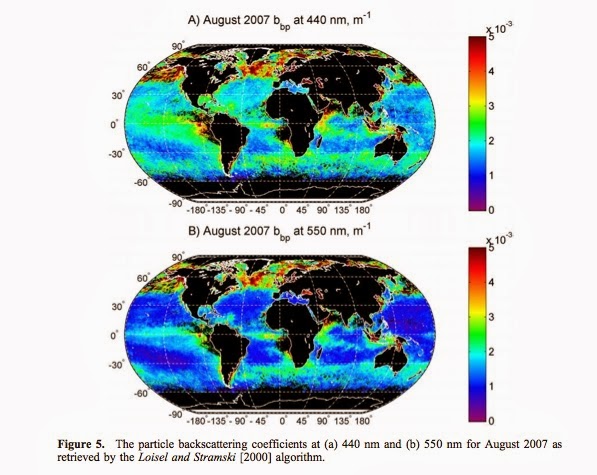
To shorten an extremely dense and quite theory heavy article, the authors were modeling which plankton sizes were most represented in which regions of the ocean given that the warmer oceans become, the smaller plankton then results, and, as a consequence, these smaller plankton species absorb less carbon- taking less carbon to the bottom of the ocean when they die. The below image represents particle size of varying microplankton particles which is represented by backscattering(physical reflection of the particles).
There were many more maps within the document to show that there are many zones in the ocean, particularly smaller particle sizes. Want to read it for yourself? You asked for it:
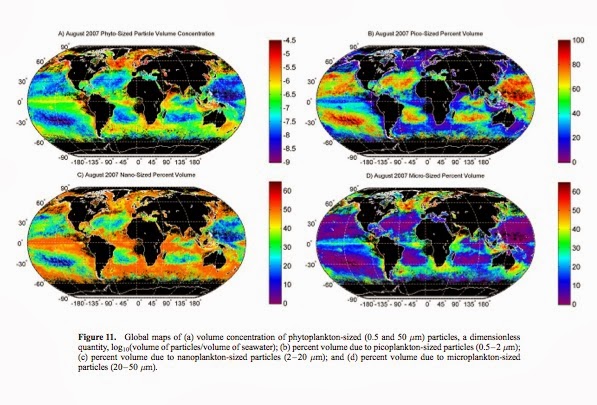
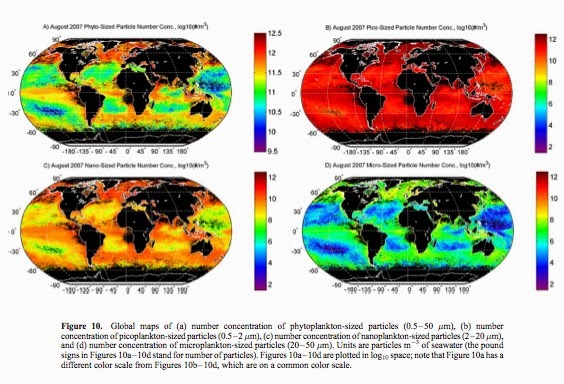
“Picoplankton-sized particles dominate total particle volume in the subtropical gyres where they contribute 60 to nearly 100% of the total particle volume (Figure 11b). Nano-sized particles are prevalent in transitional, upwelling, coastal and higher latitude regions and their maximum contribution is about 50%, which occurs over a significant fraction of the oceans (Figure 11c). Microplankton-sized particles contribute up to 50 – 60% of the volume concentration only in regions known for their high productivity, such as coastal areas, the North Atlantic bloom region, the Equatorial and Eastern Boundary Current Upwelling zones, and higher latitude zones (Figure 11d). Abundances of microplankton-sized particles are extremely low in the subtropical gyres and much of their transition zones (Figure 10d). Thus their percent contribution to the volume concentration is virtually zero in these areas”(Kostadinov et al 2009, 11).
What does this look like? This:
And this:
Conclusion? Protect the ocean: mitigate your carbon emissions, and don’t use chemicals that will harm our waterways or the ocean will cease to take our extra carbon from the atmosphere and will begin to eat away the coastlines.
DO IT.

PLEASE. JUST DO IT.
Sources:
Validanov et. al. 2009. “Retrieval of the particle size distribution from satellite ocean color observations” JOURNAL OF GEOPHYSICAL RESEARCH, VOL. 114, C09015, doi:10.1029/2009JC005303
